Yield
YieldA 365% rate paid 5.9%. The token fell 89.7%.
We logged 167,987 earn rates on 38 venues over 62 days, then joined them to daily prices. A rate above 50% loses half of itself in two days — but that is the small half of the story. Counting the token's own price, the median position ended at −1.7% and 60% finished down.
We wrote down every earn rate on 38 venues, every day, for 62 days — 167,987 readings. Then we asked one question nobody seems to publish an answer to: if you see a high rate and take it, how long does it last? The median answer is two days. A rate above 50% is worth half of itself by tomorrow and 12% of itself a week later.
Everyone in this business shows you a rate. Almost nobody shows you what happened to the last person who took it.
That is not a small omission. A savings account pays roughly the same next month as it does today. A crypto earn rate does not, and the higher it is, the less it resembles a rate at all — it behaves like a promotion with no end date printed on it.
So we measured. Since early July we have recorded the base flexible rate of every product on every venue we track, once a day, and kept it. That archive is now 2,888 coin-venue pairs deep. Points carried forward from a previous day are flagged and excluded here, so what follows is observations only.
What we did
For every moment a rate crossed a threshold, we followed that exact product — same coin, same venue — for the next 30 days, and recorded what share of the original rate was still being paid.
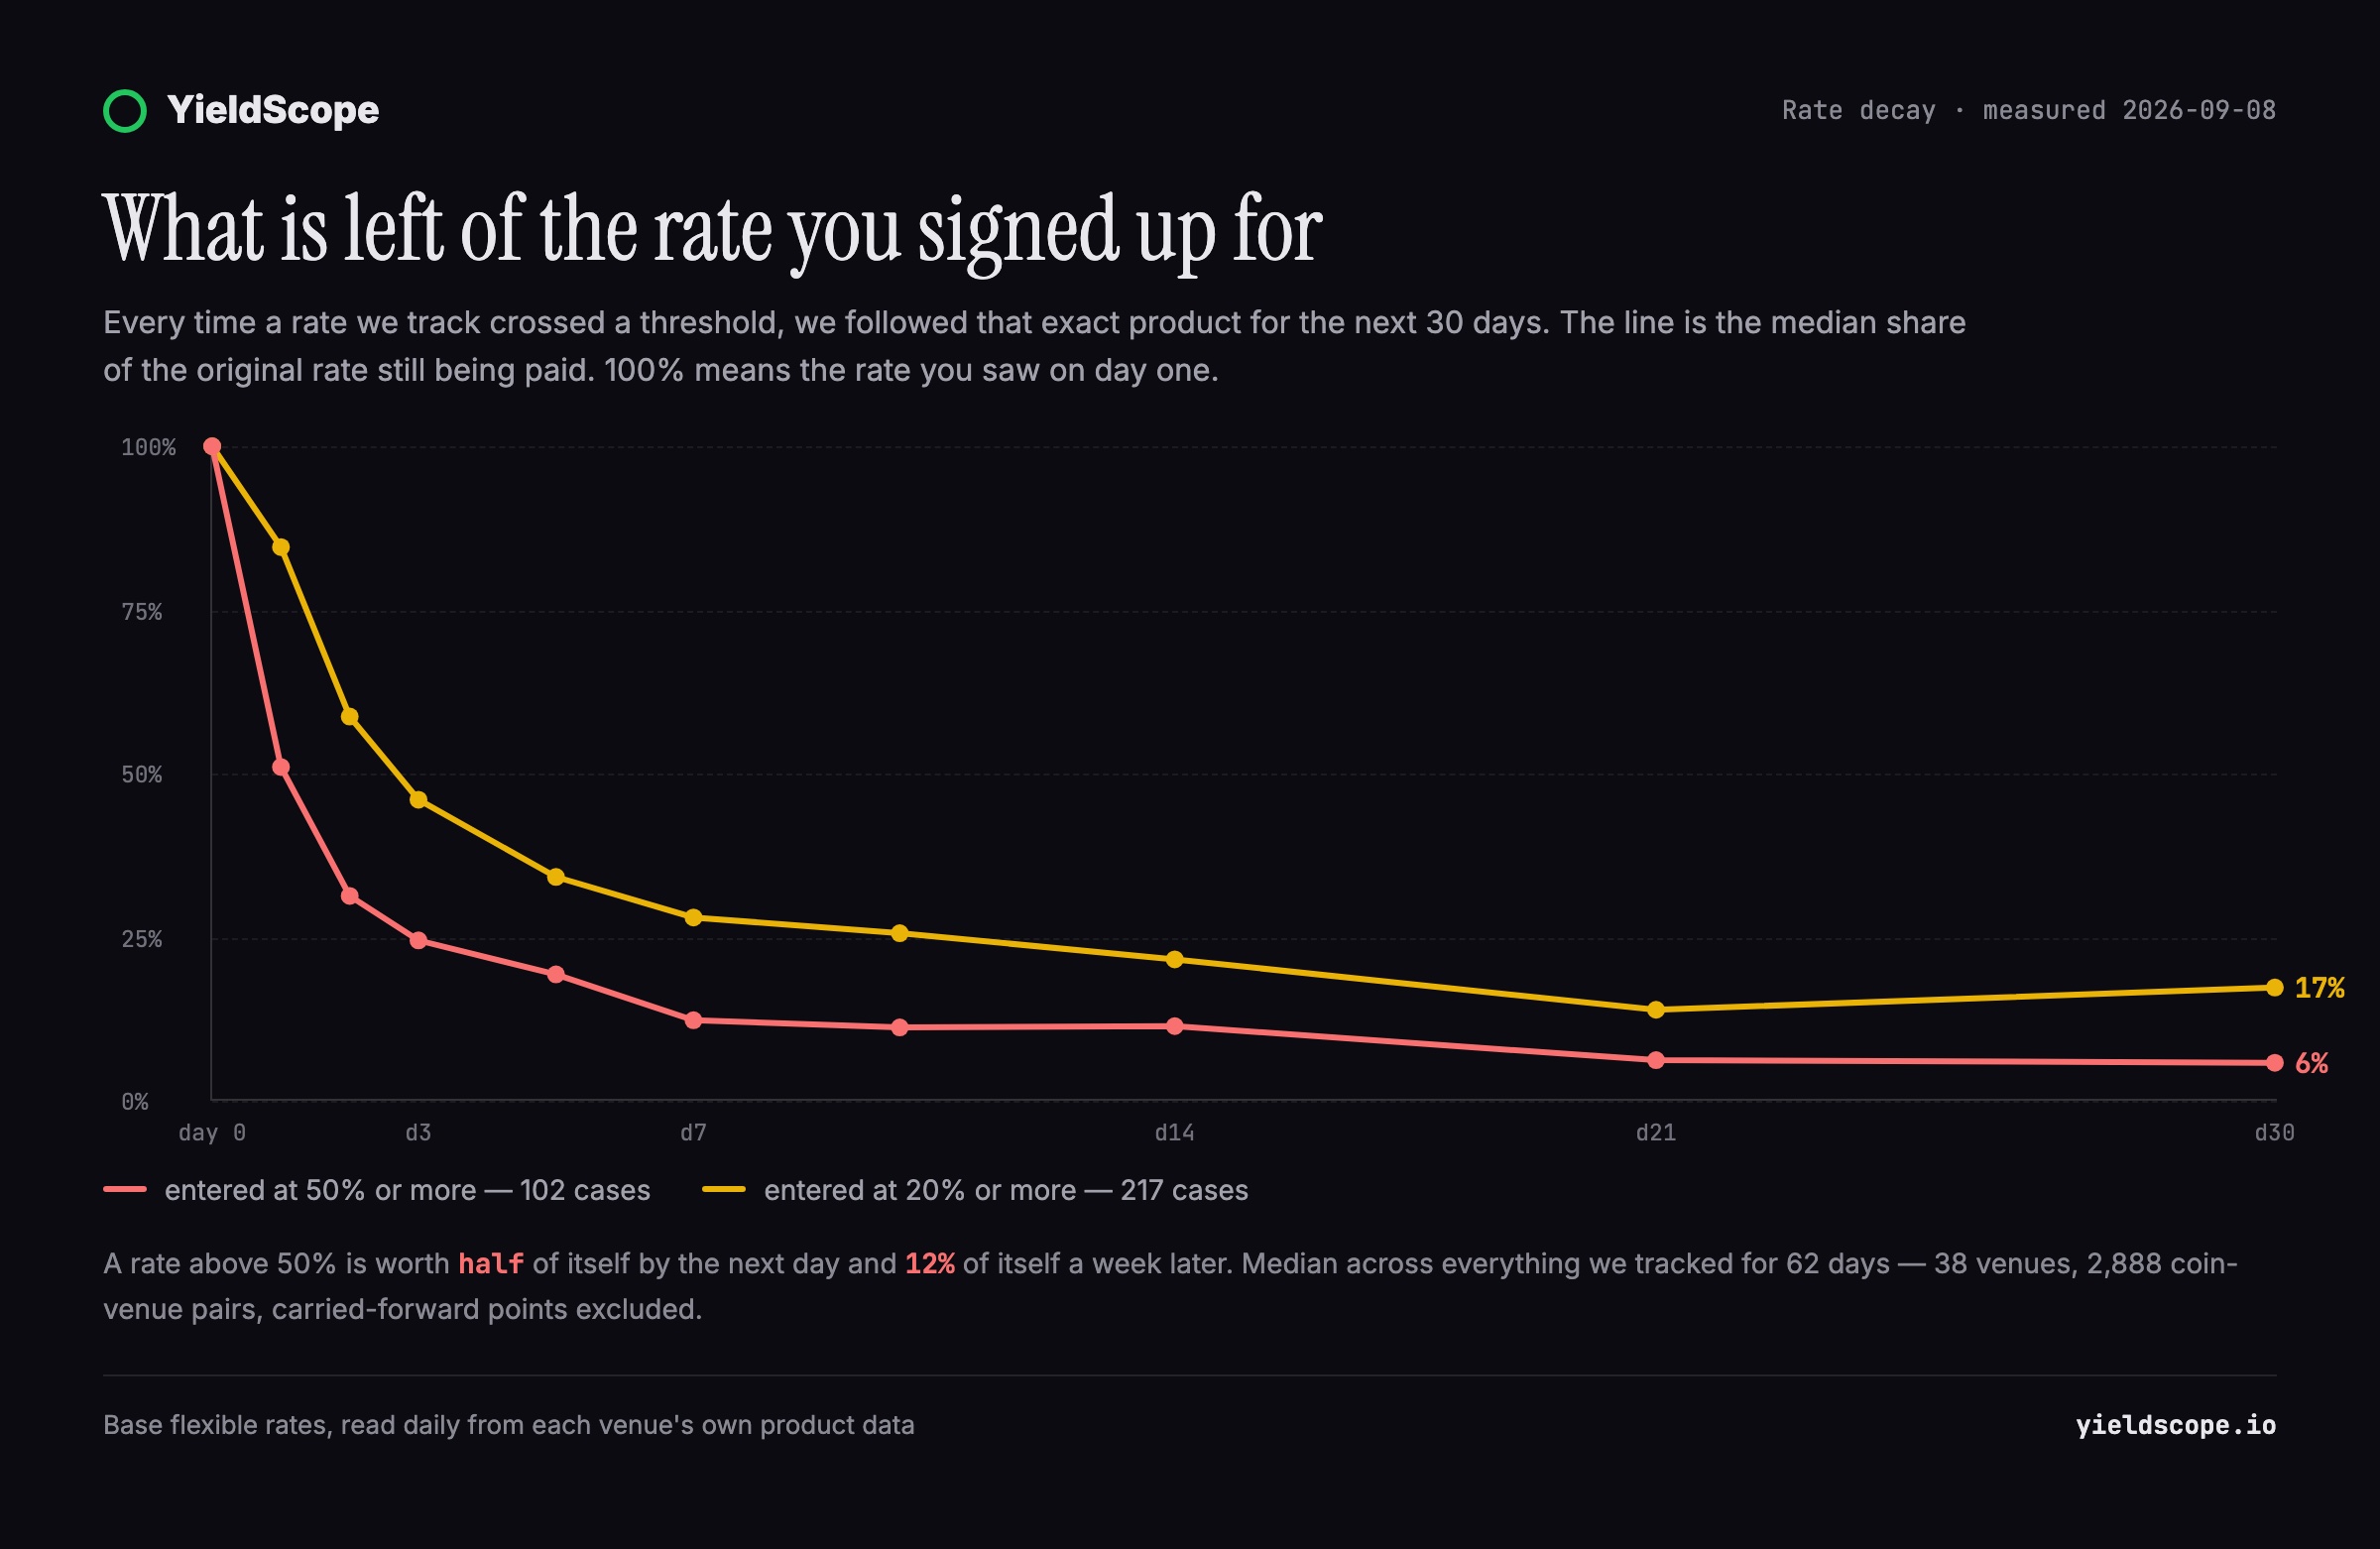
Read the red line first. It starts at a rate of 50% or more.
- Day 1 — 51% of the original rate. Half of it is gone in 24 hours.
- Day 3 — 24.5%.
- Day 7 — 12.3%.
- Day 30 — 5.8%.
The yellow line starts at 20% or more and decays more slowly, but it decays the same way: 58.7% left after two days, 28% after a week, 17.3% after a month.
Across 571 crossings of the 20% line, the median time to lose half the rate was two days. Seventy-nine percent lost half within a week.
What that means for the money
Decay curves are abstract. Here is the concrete version: somebody sees the rate, moves their coins in that day, and leaves them for a month. What do they actually earn?
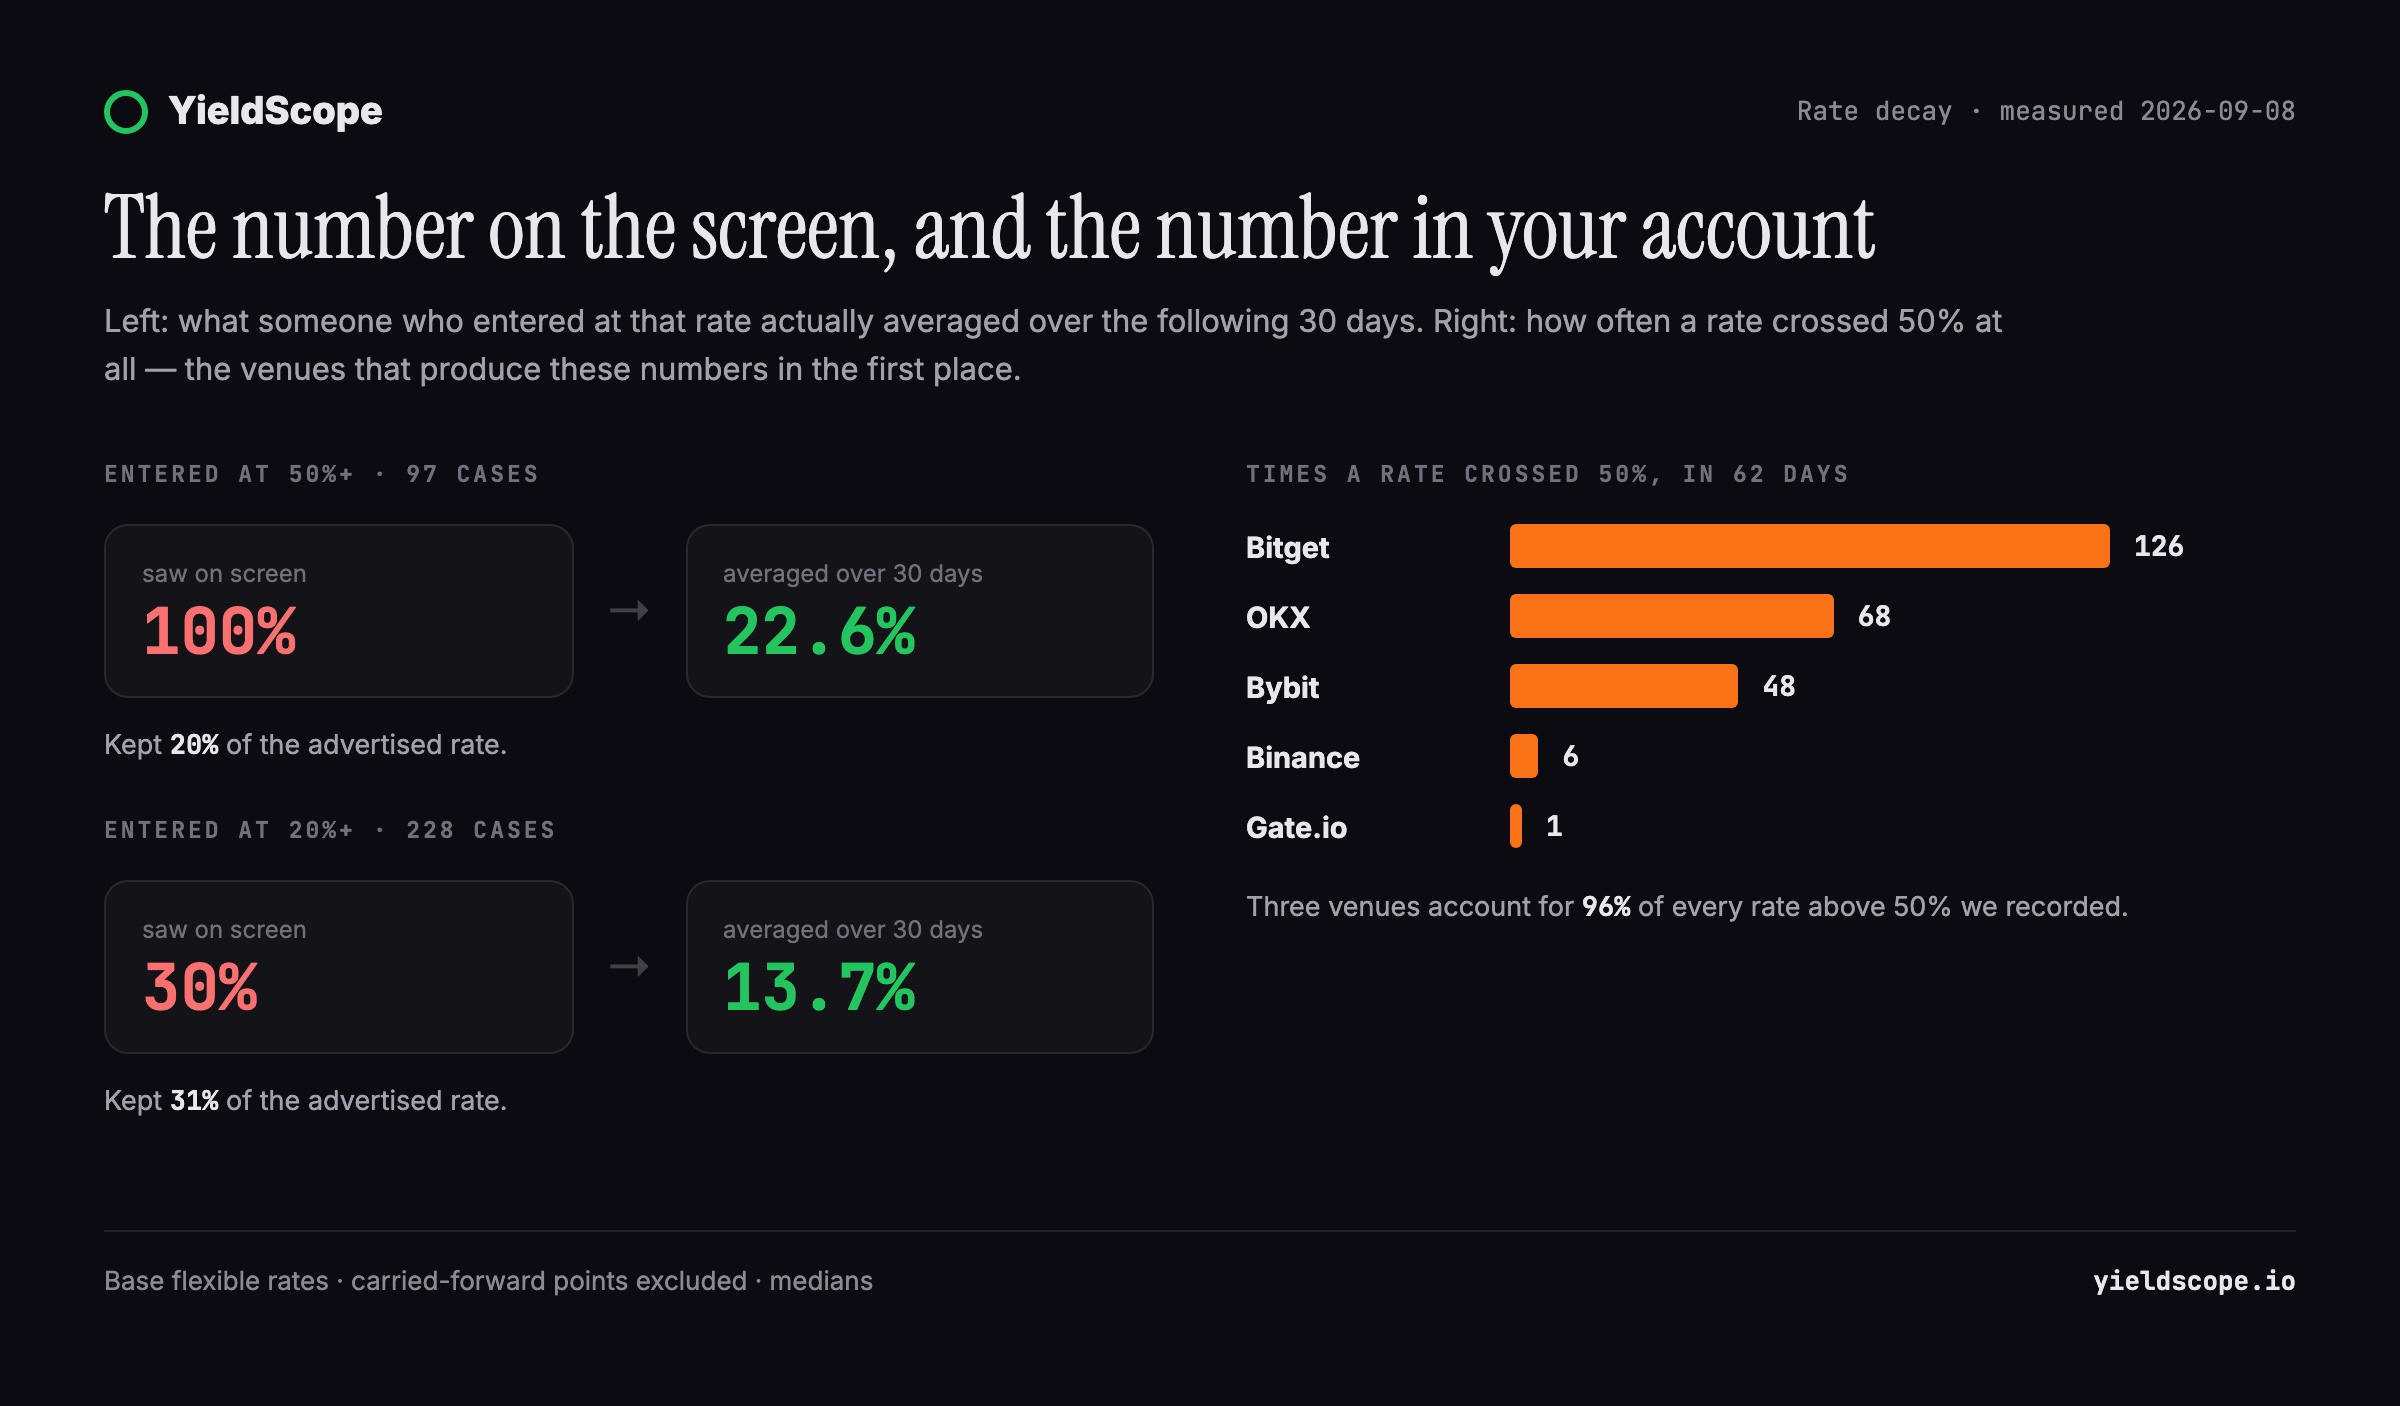
- Entered at 50% or more (97 cases): the median headline was 100%. The median rate actually paid across the following 30 days was 22.6%. They kept 20% of what they signed up for.
- Entered at 20% or more (228 cases): median headline 30%, median realised 13.7%. They kept 31%.
Note that 22.6% is still a large number. This is not an argument that the money vanishes — it is an argument that the number you are shown and the number you receive are different quantities, and the gap widens the more impressive the headline.
Where these rates come from
The rates that behave this way are not spread evenly.
Over 62 days, a rate crossed the 50% line 249 times in our data. Three venues account for 96% of them:
- Bitget — 126 crossings
- OKX — 68
- Bybit — 48
- Binance — 6
- Gate.io — 1
That is not a safety judgement. Bitget passes all five of our safety checks and holds an A; Bybit and OKX are ordinary large exchanges. It is a product-design observation: these venues run short, aggressive launch promotions on new listings, and the promotion is priced as an annual rate even though it is scheduled to last days.
The individual cases are blunter than any median:
- KMNO on Bybit — 480.1% on 7 August, 1.16% by 20 August.
- SUPER on Bitget — 365% on 24 August, 1.00% by 7 September.
- HNT on Bitget — 347% on 29 August, 1.00% by 8 September.
- POLYX on Bitget — 285.5% on 22 July, 1.00% by 5 August.
The pattern repeats with a precision that tells you it is a policy, not a market: several of these land on exactly 1.00%, which is the standing base rate underneath the promotion.
The control group: ordinary rates barely move
If everything decayed, the finding would be trivial. It does not.
We took every stablecoin product that started our observation window between 1% and 12% — 34 coin-venue pairs — and compared the opening rate with the median of the last ten days. The typical pair kept 97% of its rate over two months. Several went up: USDT on Binance drifted from 1.41% to 2.79%, USDe on Gate from 1.80% to 4.75%.
So a rate is not inherently unstable. What decays is a specific kind of rate: the promotional one.
The exceptions prove the same point from the other side. The steepest falls in this group were also the highest starting numbers — USDT on BingX went from 11.00% to 1.00%, USDC on the same venue from 7.00% to 0.40%. An 11% stablecoin rate is not a stablecoin rate; it is a promotion wearing one.
That gives a cleaner rule than "avoid altcoins". It is not the coin that predicts decay. It is the distance between the rate and what the rest of the market pays for the same asset. Our tables put every venue's rate for a coin side by side precisely so that distance is visible in one glance.
Why an annual rate is the wrong unit here
There is a reason these numbers reach 365%: a lot of them are a fixed daily reward pool expressed as an annual percentage. If a venue sets aside a pot for a launch week and divides it by the coins subscribed, the resulting APY is arithmetically real and economically meaningless — it describes a rate of payment that was never going to run for a year.
Quoting it annually is not fraud, and every venue we looked at does display the rate as variable. But it does mean the unit is doing work it was not designed for. "365% APY" and "4.00% APY at a bank" are printed in the same font and mean entirely different kinds of promise.
This is also why we publish base rates and never promo tiers, and why our own tables carry the date each figure was read.
The part we almost published without
Everything above measures the rate. That turns out to be the smaller half of the story, and publishing it alone would have been misleading.
A rate is paid in the coin you deposited. If that coin loses a third of its value while you hold it, the rate is a rounding error on your actual result. So we joined the rate archive to daily prices and recalculated: for every case where someone entered above 50%, what did the position do over the next 30 days, counting both the rate paid and the token's own price?
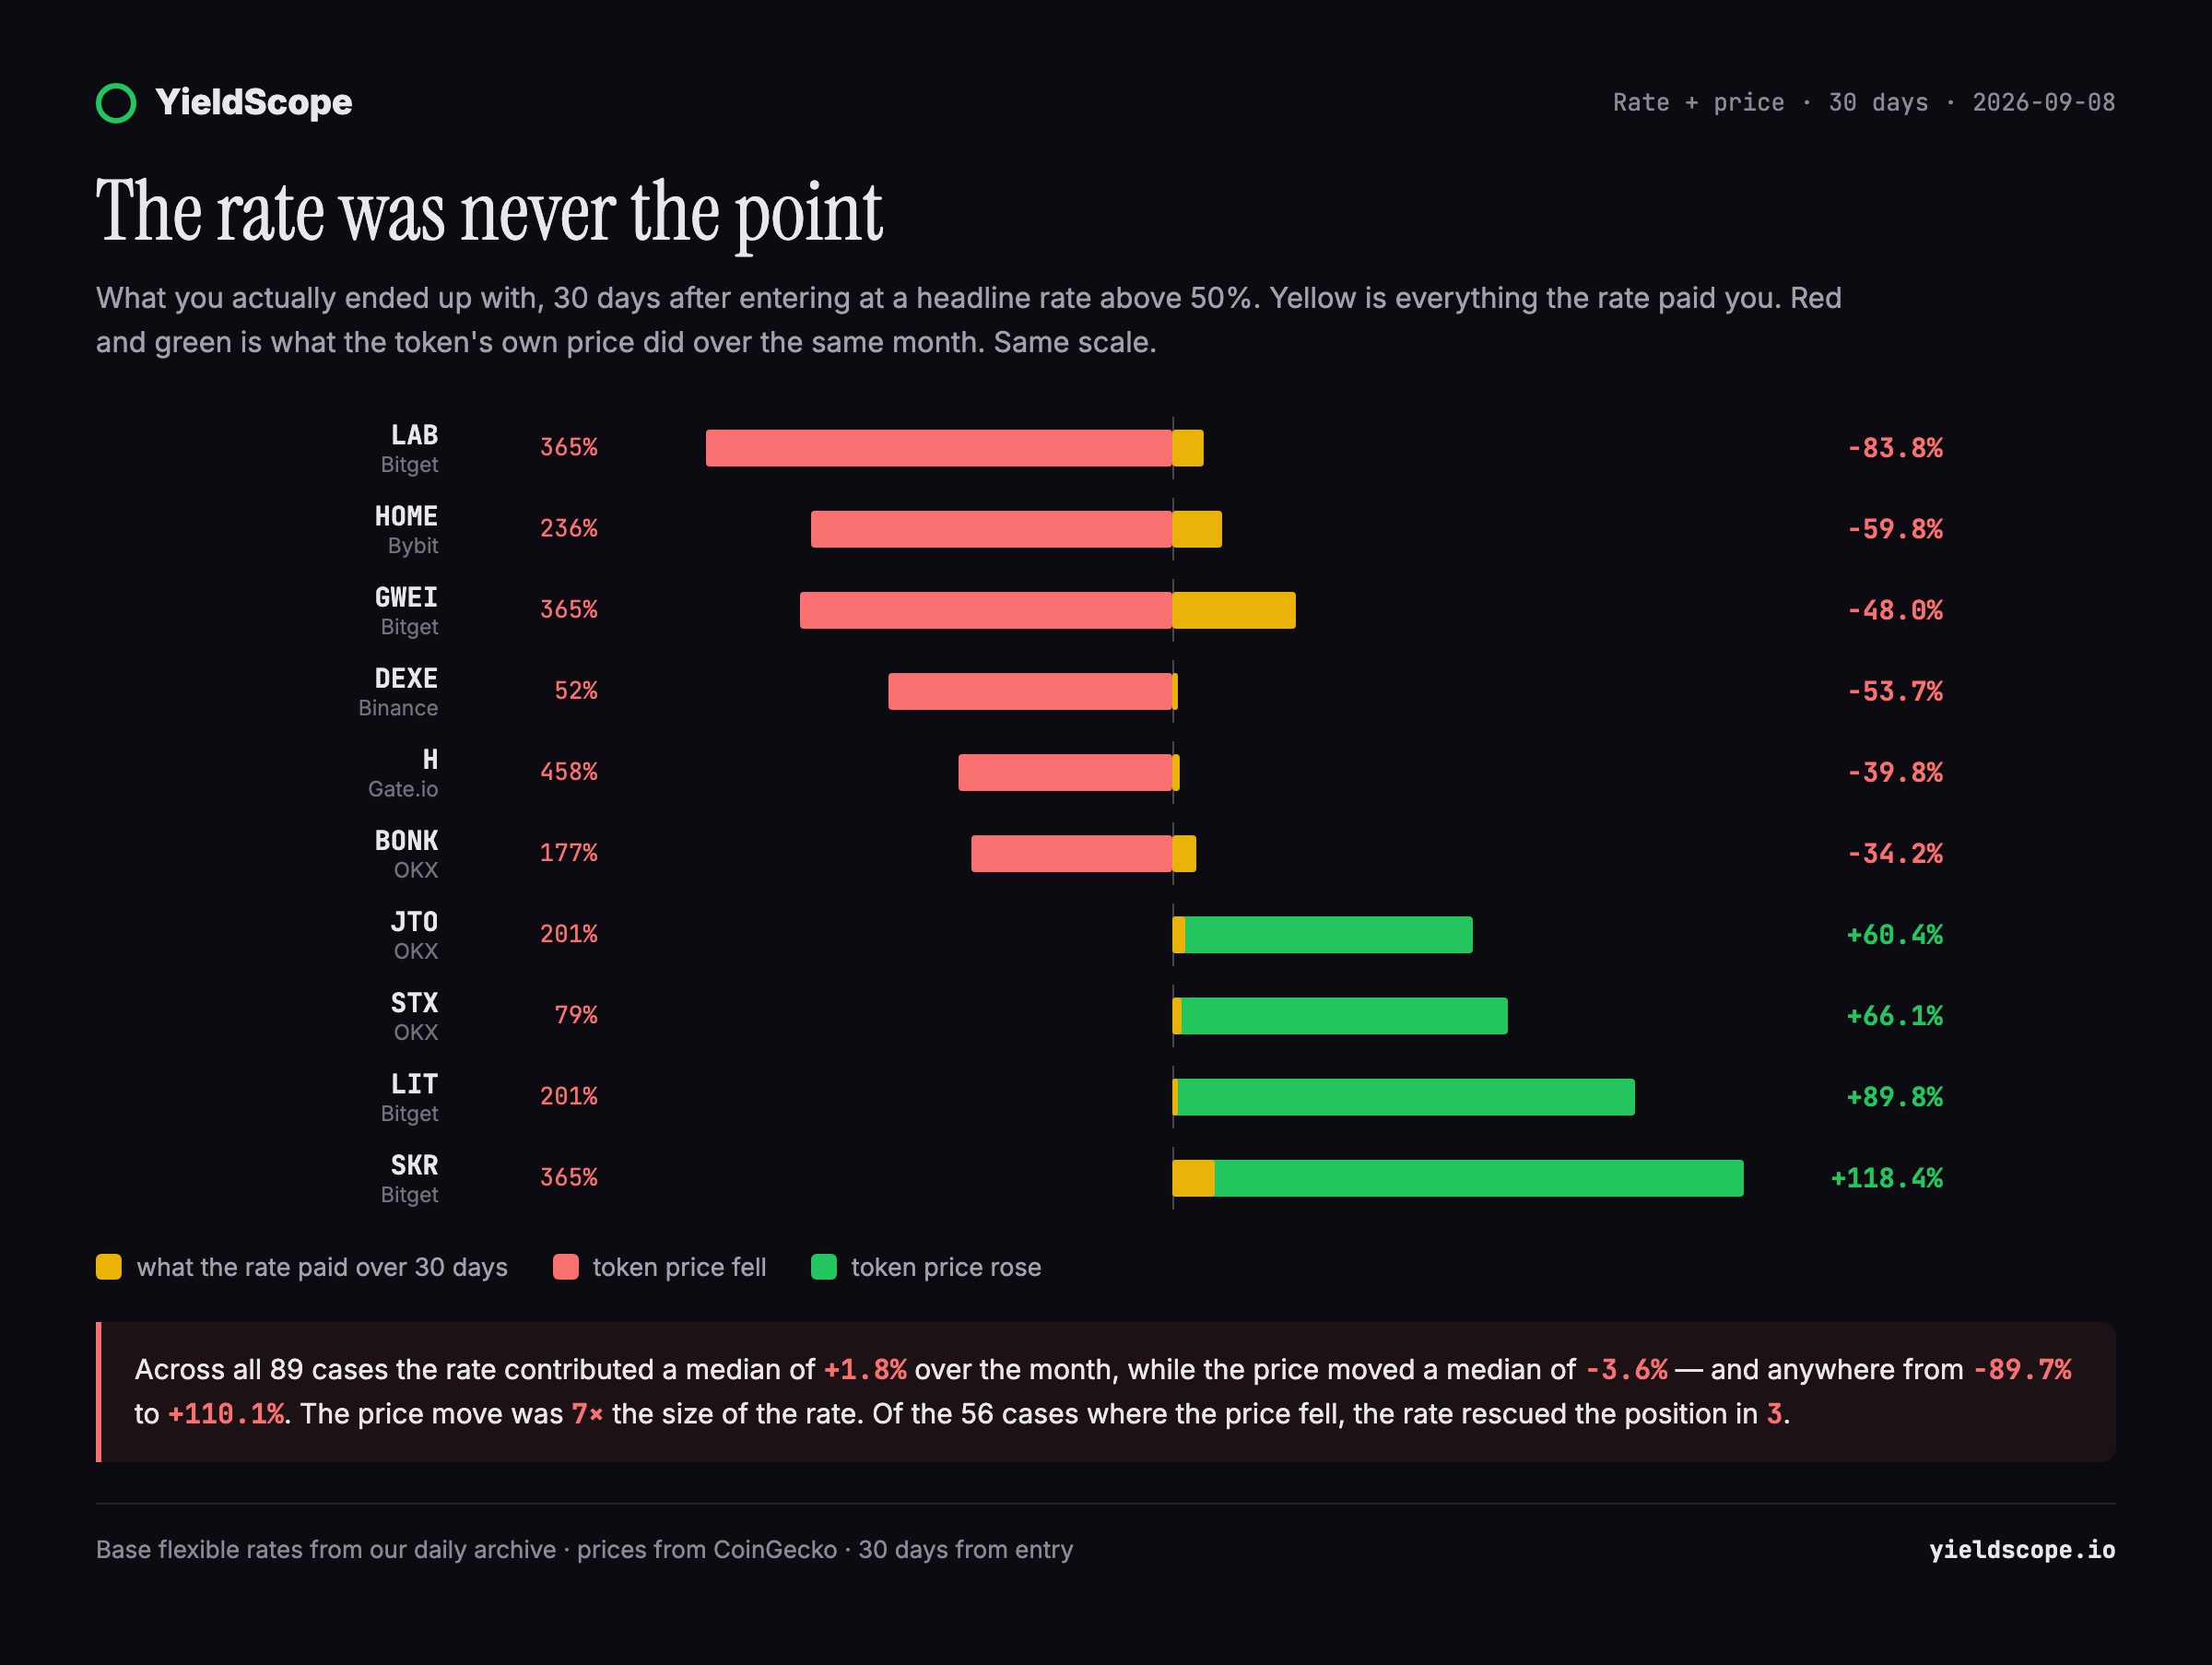
Across the 89 cases with full price history:
- The rate contributed a median of +1.8% over the month.
- The token price moved a median of −3.6%, with a range from −89.7% to +110.1%.
- The median combined result was −1.7%. Sixty percent of positions ended down.
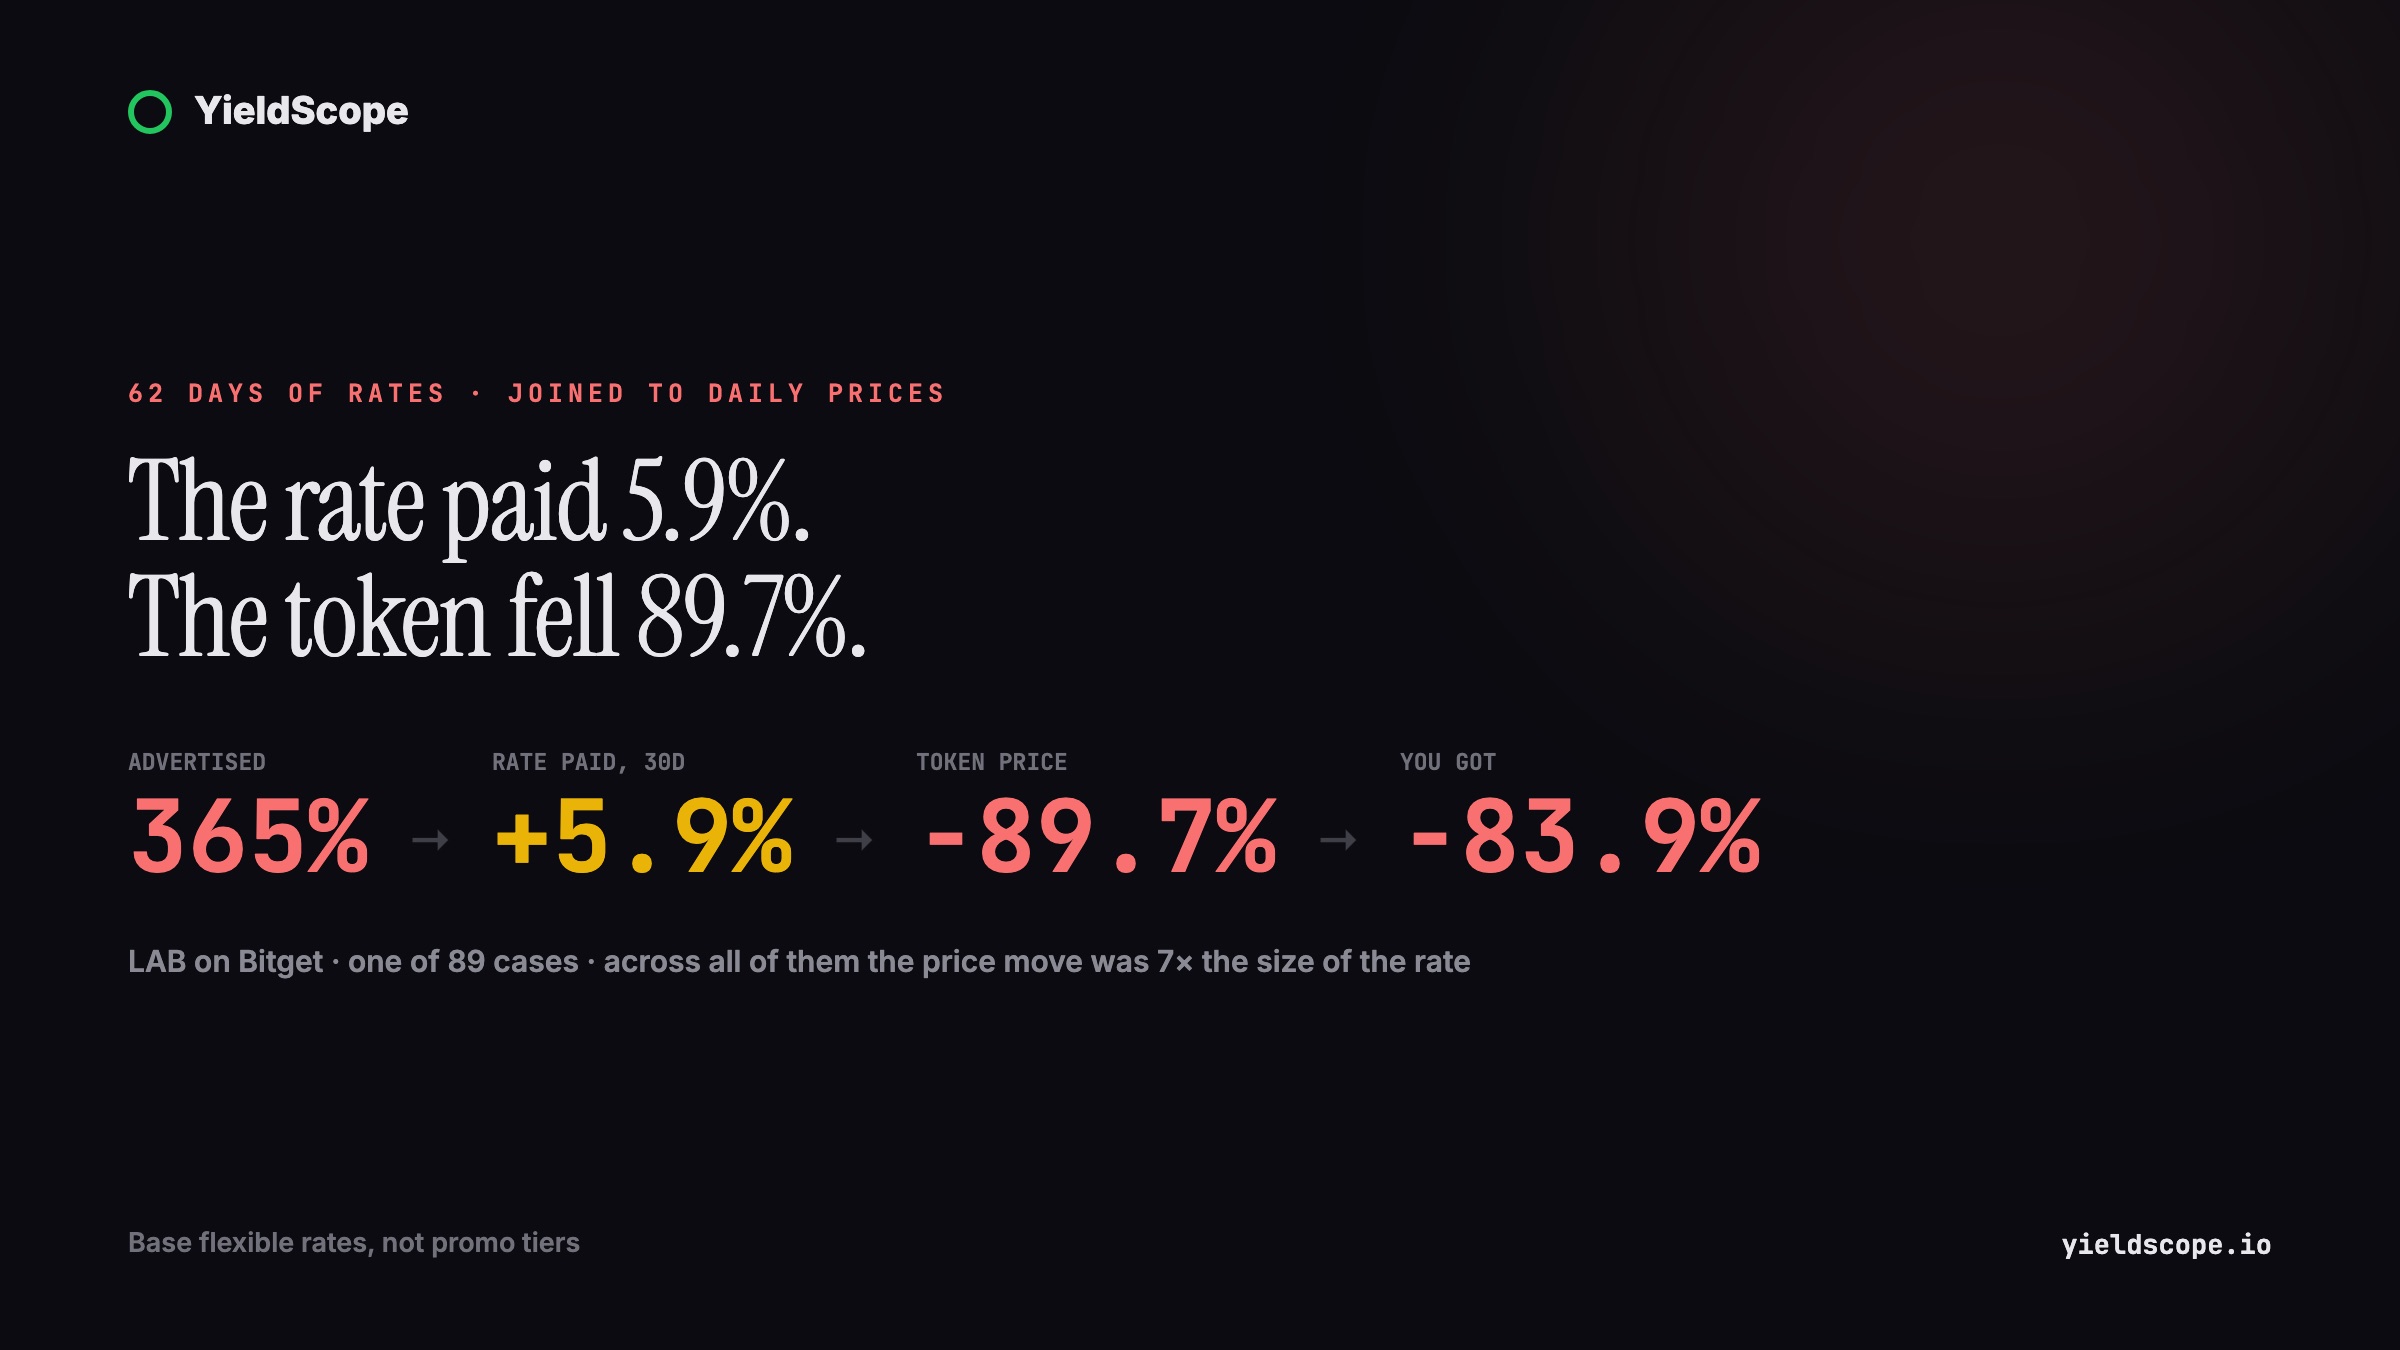
Look at the top row of the chart. LAB on Bitget advertised 365%. The rate paid 5.9% over the month. The token fell 89.7%. Final result: −83.9%.
And the honest other side, because it exists: SKR on Bitget also advertised 365%, the rate paid 8.3%, and the token rose 110.1%, ending at +118.4%. Whoever held that made real money — from the price, not the rate.
That is the finding. The price move was seven times the size of the rate contribution, at the median. Of the 56 cases where the price fell, the rate rescued the position into profit three times. In only 4% of cases did the rate pay even 10% over the month.
So a 365% headline does not describe an investment that pays 365%. It describes a volatile token that you happen to be holding, plus a couple of percent of noise. The number that decides your outcome is not on the earn page at all.
What to do with a high rate
The advice changes once the price is in the picture.
- Judge the coin first, the rate second. If you would not hold this token without the rate, the rate is not a reason to hold it. It moves your result by a couple of percent a month; the token moves it by tens.
- Ask what the rate is a share of. Where a venue publishes a quota — the top rate applies only to the first N coins — the headline is a slice, not a rate. We covered that mechanic separately.
- Assume the clock started before you arrived. By the time a rate reaches a comparison site it has usually been live a day or more, and the steepest decay is day one.
- Look at the base underneath. In every example here the floor was 1.00%. That floor is the honest number; the promotion is weather on top of it.
- If you want yield rather than exposure, hold something whose price does not move. A dollar stablecoin at 5.5% on a well-graded venue pays less than the headline and keeps the thing the headline is quoted in.
How this was measured
Every figure here comes from our own daily archive — base flexible rates read from each venue's product data, one reading per coin per venue per day, since 9 July 2026. Carried-forward points, where a venue was not reachable and the previous value was rolled over, are flagged in the data and excluded from every calculation on this page. Prices are daily closes from CoinGecko, joined to the rate archive by date. Medians rather than means throughout, because a handful of 365% entries would drag an average anywhere you liked. The combined-return section covers the 89 cases where we hold both a rate crossing above 50% and a full 30-day price series.
You can see today's rates for any coin on its own page — for example USDT — and every venue with its safety grade in the ranking.
Rates float; each figure is a snapshot with its reading date. Not financial advice.
Educational content, not financial or legal advice. Sources are linked in the text.